Australian Health Survey: Biomedical Results for Chronic Diseases

Latest release

Information on biomarkers of chronic disease, including prevalence rates for risk factors for cardiovascular disease, diabetes and kidney function

Reference period
2011-12 financial year
Released
5/08/2013
Next release Unknown
First release

Key findings

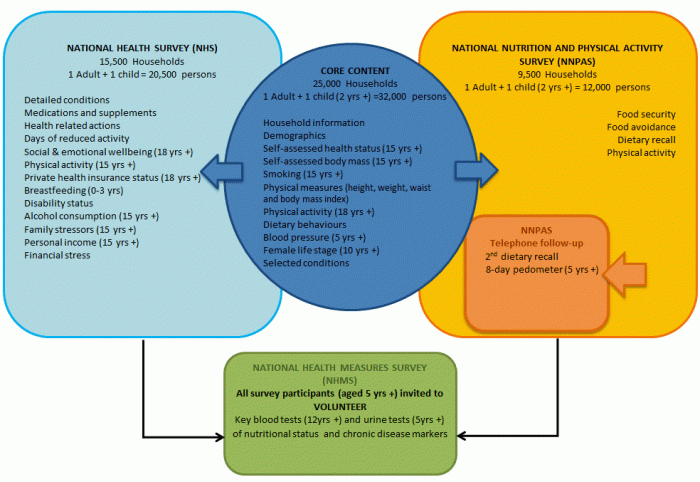
Results in this publication contain information from the National Health Measures Survey (NHMS), the biomedical component of the 2011–13 Australian Health Survey (AHS). Around 11,000 respondents aged 5 years and over across Australia voluntarily provided blood and/or urine samples, which were tested for a range of chronic disease and nutrition biomarkers. This publication is the first release of information from the NHMS and focuses on the test results for chronic diseases, including:

  • Diabetes
  • Cardiovascular disease
  • Chronic kidney disease
  • Liver function
     

Refer to Appendix A for the full list of tests conducted.

Diabetes

  • In 2011–12, 5.1% of people aged 18 years and over had diabetes.
  • This comprised 4.2% with known diabetes and 0.9% with diabetes newly diagnosed by the blood test results. This suggests that there was approximately one newly diagnosed case of diabetes for every four diagnosed cases.
  • Men were more likely than women to have diabetes (6.3% compared with 3.9%). This was the case for both known diabetes and newly diagnosed diabetes.
  • A further 3.1% of Australian adults were identified by their test results to be at high risk of diabetes.
     

Cardiovascular disease

    • Around one in three Australian adults (32.8%) had high levels of total cholesterol according to their blood test results, yet only 10.1% of this group self-reported high cholesterol as a current health condition.
    • One in three Australian adults (33.2%) had high levels of LDL 'bad' cholesterol and 23.1% had lower than normal levels of HDL 'good' cholesterol.
    • In 2011–12, 13.9% of people aged 18 years and over had high triglycerides.
    • Three in every four adults (76.4%) aged 45 years and over had dyslipidaemia. That is, they were taking cholesterol-lowering medication or had one or more of high total cholesterol, low HDL cholesterol, high LDL cholesterol or high triglyceride levels based on their test results.
       

    Chronic kidney disease

      • In 2011–12, one in ten (10.0%) Australian adults had test results that showed signs of chronic kidney disease, with similar rates for men and women.
      • Around 4% of all adults were in Stage 1, 2.5% were in Stage 2 and less than 1% were in Stages 4–5.
         

      Liver function

      A range of factors, including fatty liver disease, infections and excessive alcohol consumption can prevent the liver from functioning properly. The NHMS included two tests for liver function: gamma glutamyl transferase (GGT) and alanine aminotransferase (ALT). These tests check the liver’s health and can detect liver damage.

      • In 2011–12, 11.0% of Australian adults had abnormal levels of ALT in their blood, with men more likely to have the condition than women (13.8% compared with 8.3%).
      • Around 2.1 million (or 12.4%) people aged 18 years and over were estimated to have abnormal levels of GGT.
         

      Exposure to tobacco smoke

        • In 2011–12, the pattern for cotinine exposure was very similar to that for self-reported smoking for most age groups.
        • 87.0% of current smokers aged 18 years and over had cotinine levels indicating exposure to tobacco smoke, compared with only 5.7% of those who were ex-smokers and 0.3% of those who had never smoked.
           

        Anaemia

          Anaemia is caused from a decrease in either the number of red blood cells in the body or the quantity of haemoglobin within red blood cells. When a person is anaemic, their heart has to work harder to ensure that muscles and organs get the oxygen they need.

          • In 2011–12, 4.5% of people aged 18 years and over had haemoglobin levels indicating a risk of anaemia, with women more likely to be at risk than men (6.4% compared with 2.5%).
          Diabetes

          Diabetes is a chronic condition where insulin, a hormone that controls blood glucose levels, is no longer produced or not produced in sufficient amounts by the body.¹ If left undiagnosed or poorly managed, diabetes can lead to coronary heart disease, stroke, kidney failure, limb amputations or blindness. In 2011, diabetes was the sixth leading cause of death in Australia.²

          The National Health Measures Survey (NHMS) provides an objective measurement of the number of people with diabetes in Australia. It included two tests to measure diabetes: a fasting plasma glucose test and a glycated haemoglobin test (commonly referred to as HbA1c).

          Fasting plasma glucose measures the level of sugar in the person's blood at the time of testing. Participants were required to fast for 8 hours prior to the test in order to get an accurate reading. HbA1c, on the other hand, measures what the person's average blood glucose level has been in the previous three months. Participants were not required to fast for this test. A set of cut-offs are used for each test to determine whether a person has diabetes or is at high risk of diabetes. The cut-offs used in the NHMS are shown below.

          Cut-offs for diabetes in the NHMS

           Fasting plasma glucose (mmol/L)(a)HbA1c (%)(b)
          Has diabetes≥7.0≥6.5
          At high risk of diabetes6.1 to <7.06.0 to <6.5
          No diabetes<6.1<6.0

          a. Based on World Health Organization cut-offs for fasting plasma glucose.
          b. An HbA1c level of greater than or equal to 6.5% is the WHO recommended cut-off point for diabetes.
           

          Endnotes

          Measuring diabetes - definitions

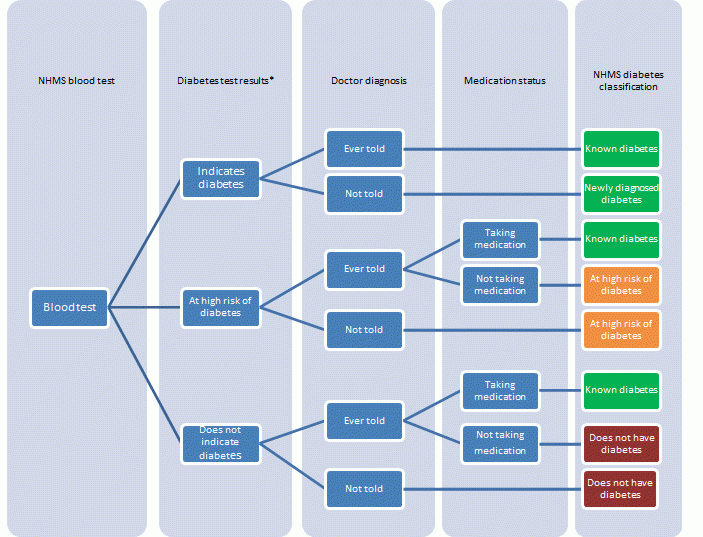
          In the National Health Measures Survey (NHMS), two blood tests for diabetes were performed: fasting plasma glucose and glycated haemoglobin (commonly referred to as HbA1c). The tables available in the Data downloads section of this publication present diabetes prevalence rates for both tests, including a comparison of the two tests in table 3. However, as fasting plasma glucose is the current standard test for diabetes in Australia, the results presented in the publication commentary focus on fasting plasma glucose only.

          Read more

          Endnotes

          Diabetes prevalence

          Diabetes prevalence was derived using a combination of blood test results and self-reported information on diabetes diagnosis and medication use. See the Measuring diabetes - definitions section for a detailed description.
           

          Data source and definitions

          Fasting plasma glucose is the current standard test for diabetes in Australia. The information on diabetes in the following sections is based on fasting plasma glucose results only. Information on diabetes prevalence using glycated haemoglobin (commonly referred to as HbA1c) test results is shown in Tables 1, 2, 3, 8, 9, 12 and 15 in the Data downloads section of this publication.

          In order to get an accurate reading for the fasting plasma glucose test, people were required to fast for 8 hours or more beforehand. The results presented here refer only to those people who did fast (approximately 79% of adults who participated in the National Health Measures Survey (NHMS)).

          In 2011–12, 5.1% of Australians aged 18 years and over had diabetes. This comprised 4.2% with known diabetes and 0.9% with diabetes newly diagnosed from their test results. This indicates that there was approximately one newly diagnosed case of diabetes for every four diagnosed cases. A further 3.1% of adults had impaired fasting plasma glucose results, which indicates that they were at high risk of diabetes. This means that there were an extra three people at high risk of diabetes for every four people who had been diagnosed.

          Read more

          Endnotes

          Diabetes management

          Glycated haemoglobin (HbA1c) is used to measure how well a person is managing their diabetes. This test gives an indication of the person's average blood glucose levels over the previous three months. The optimum management target for HbA1c for people with diabetes is a level of 7.0% or less. Maintaining this level decreases a person's risk of developing a range of complications from their diabetes, including problems with their circulation, kidneys, eyes and feet, and lowers the risk of heart attack and stroke. There is also a range of other optimum targets for diabetes management, including those for cholesterol levels, Body Mass Index (BMI) and blood pressure.¹ These are listed in the data source and definitions section below.

          Data source and definitions

          In the National Health Measures Survey (NHMS), information on diabetes management is presented for those with known diabetes. See the Measuring diabetes - definitions section for information on how this population is defined. The information in this section is based on fasting plasma glucose results only. Information on diabetes management using glycated haemoglobin (commonly referred to as HbA1c) test results is shown in table 14 in the Data downloads section of this publication.

          Goals for optimum diabetes management, as defined by the 2012–13 Diabetes Management in General Practice Guidelines¹, are as follows:

          • Fasting blood glucose levels between 4.0–6.0 mmol/L
          • HbA1c levels less than or equal to 7.0%
          • Total cholesterol less than 4.0 mmol/L
          • HDL 'good' cholesterol greater than 1.0 mmol/L
          • LDL 'bad' cholesterol less than 2.0 mmol/L
          • Non-HDL-C cholesterol less than 2.5 mmol/L
          • Triglycerides less than 2.0 mmol/L
          • Albumin creatinine ratio (a test relating to level of kidney damage) less than 3.5 mg/mmol for women and less than 2.5 mg/mmol for men
          • Blood pressure less than or equal to 130/80 mmHg
          • 'Normal' Body Mass Index (i.e. a BMI score of between 18.0 and 24.9)
          • Non-smoker
          • Alcohol intake less than or equal to 2 standard drinks per day*
          • At least 30 minutes of physical activity 5 days per week*
             

          *Note information on alcohol and physical activity targets have not been included in this release, as data for these variables are not available for all persons in the NHMS. However, this information can be sourced from the National Health Survey component and will be available at a later date.

          Read more

          Endnotes

          Cardiovascular disease

          Cardiovascular disease remains one of the leading causes of death worldwide. In 2011, ischaemic heart disease, which includes angina, blocked arteries of the heart and heart attacks, was the leading cause of death for all Australians, representing 14.6% of all deaths registered in 2011.¹ The onset of cardiovascular disease can be delayed or prevented through reducing risk factors such as lowering cholesterol, following a healthy diet and avoidance of smoking.

          The main indicators of cardiovascular disease that were measured in the National Health Measures Survey (NHMS) were cholesterol, including total, high density lipoprotein (HDL) and low density lipoprotein (LDL), and triglycerides.

          Blood pressure is also an important measure of cardiovascular risk and was measured for all persons in the Australian Health Survey (AHS). Detailed information on the prevalence of high blood pressure and hypertension for all Australians can be found in Australian Health Survey: Updated Results.

          Endnotes

          Cholesterol

          Cholesterol is a type of fat that circulates in the blood. It is essential for many metabolic processes, including the production of hormones and building cells. There are two main types of cholesterol: high density lipoprotein (HDL) and low density lipoprotein (LDL). HDL cholesterol is known as 'good' cholesterol, as it picks up excess cholesterol in the blood and takes it to the liver where it is broken down, helping to prevent blockages. Low levels of HDL may increase the risk of heart disease. LDL cholesterol, on the other hand, is known as 'bad' cholesterol, as high levels in the bloodstream can lead to fatty deposits developing in the arteries, increasing the risk of heart attack or stroke.

          Data source and definitions

          Cholesterol levels are measured using a blood test. Abnormal cholesterol levels are defined as follows:

          • Total cholesterol greater than or equal to 5.5 mmol/L
          • HDL cholesterol less than 1.0 mmol/L for men and less than 1.3 mmol/L for women
          • LDL cholesterol greater than or equal to 3.5 mmol/L

          In order to get an accurate reading for the LDL cholesterol, people were required to fast for 8 hours or more beforehand. The results presented here refer only to those people who did fast (approximately 79% of adults who participated in the National Health Measures Survey (NHMS)).

          Read more

          Endnotes

          Triglycerides

          Like cholesterol, triglycerides are a fatty substance in the blood. However, triglycerides work more like a type of fuel, circulating in the bloodstream to be used as energy by the cells. Research shows that high blood triglycerides are an independent risk factor for heart disease as they contribute to the development of atherosclerosis, which is the build up of fatty deposits in the blood vessels.¹ High triglycerides are typically caused by a diet high in fat or kilojoules, but can also become elevated as a result of having other conditions, such as diabetes and kidney disease.

          Data source and definitions

          Triglycerides are measured using a blood test. Abnormal triglyceride levels were defined as greater than or equal to 2.0 mmol/L.

          In order to get an accurate reading for triglycerides, people were required to fast for 8 hours or more beforehand. The results presented here refer only to those people who did fast (approximately 79% of adults who participated in the National Health Measures Survey).

          Read more

          Endnotes

          Dyslipidaemia

          Dyslipidaemia refers to a number of different lipid disorders (that is, conditions where there are too many fats in the blood). Estimates of dyslipidaemia from the National Health Measures Survey (NHMS) can be used to determine how many Australians have at least one lipid disorder and therefore have an increased risk of heart disease. 

          Data source and definitions

          In the NHMS, a person was classified as having dyslipidaemia if they had one or more of the following:

          • Taking cholesterol-lowering medication 
          • Total cholesterol greater than or equal to 5.5 mmol/L 
          • HDL cholesterol less than 1.0 mmol/L for men and less than 1.3 mmol/L for women 
          • LDL cholesterol greater than or equal to 3.5 mmol/L 
          • Triglycerides greater than or equal to 2.0 mmol/L.

          In 2011–12, 63.2% of people aged 18 years and over had dyslipidaemia. This comprised 13.8% who took some form of cholesterol-lowering medication and 49.4% who took no medication but had either high total cholesterol, low HDL cholesterol, high LDL cholesterol or high triglyceride levels based on their test results. There was no significant difference in rates of dyslipidaemia between men and women (63.7% compared with 62.8%). 

          Read more

          Chronic kidney disease

          Kidney disease is a chronic disease in which a person's kidney function is reduced or damaged. This affects the kidney's ability to filter blood and therefore control the body's water and other hormone levels, leading to increased fluid and waste within the body. This can cause high blood pressure, anaemia, and uremia. Kidney disease is also associated with several other chronic diseases such as diabetes and cardiovascular disease, and was the 10th leading cause of death in Australia in 2011.¹

          The indicators of kidney disease that were measured in the National Health Measures Survey (NHMS) were estimated glomerular filtration rate (eGFR) and urinary albumin creatinine ratio (ACR). Chronic kidney disease stages were also determined through a combination of participants' eGFR and ACR results.

          It is important to note that while abnormal eGFR or ACR results in the NHMS may indicate impaired kidney function, they cannot provide a diagnosis for kidney disease based on a single test alone. Kidney disease can only be confirmed if albuminuria or eGFR of less than 60 mL/min/1.73 m² is persistent for at least three months.²

          Endnotes

          Kidney disease biomarkers

          The National Health Measure Survey (NHMS) measured two aspects of kidney function: estimated glomerular filtration rate (eGFR) and the presence of albuminuria. eGFR uses a formula to estimate the amount of blood the kidneys filter per minute, which indicates if and to what extent kidney function is impaired. Albuminuria occurs when albumin (a protein) leaks into the urine from the blood through the kidneys.¹ While abnormal levels on either test indicate the presence of some form of kidney damage, they alone cannot diagnose kidney disease.

          Data source and definitions

          The NHMS included two tests for kidney function: estimated glomerular filtration rate (eGFR) and the presence of albuminuria.
          eGFR

          • eGFR was measured via a blood test. Abnormal kidney function using eGFR is defined as a reading of less than 60 mL/min/1.73m².

          Albuminuria

          • Presence of albuminuria was measured via a urine test. The presence of albuminuria is defined as an albumin creatinine ratio (ACR) reading of greater than or equal to 2.5 mg/mmol for males and greater than or equal to 3.5 mg/mmol for females.

          Read more

          Endnotes

          Chronic kidney disease stages

          Chronic kidney disease has a number of stages, ranging in severity from Stage 1 to Stage 5, with the early stages often showing no symptoms. An individual's kidney function can improve or regress during the early stages of the disease but once Stages 4 and 5 are reached, also known as end stage kidney disease, kidney function is unlikely to improve. A person with end stage kidney disease is generally reliant on kidney replacement therapy in the form of dialysis or kidney transplant.

          Data source and definitions

          Chronic kidney disease stages were determined by combining the participants' estimated glomerular filtration rate (eGFR) results with their albumin creatinine ratio (ACR) results. The different stages were defined as follows:

          • No indicators of chronic kidney disease - eGFR ≥60 mL/min/1.73 m² and no presence of albuminuria
          • Stage 1 - eGFR ≥90 mL/min/1.73 m² & albuminuria
          • Stage 2 - eGFR 60–89 mL/min/1.73 m² & albuminuria
          • Stage 3a - eGFR 45–59 mL/min/1.73 m²
          • Stage 3b - eGFR 30–44 mL/min/1.73 m²
          • Stage 4–5 - eGFR <30 mL/min/1.73 m²

          Read more

          Endnotes

          Liver function

          The liver works as the body's filter, removing toxins from the blood, processing nutrients and regulating its metabolism. A range of factors, including fatty liver disease, infections and excessive alcohol consumption can prevent the liver from performing these functions and if left untreated, can lead to liver damage.¹ When the liver is inflamed or damaged, enzymes including alanine aminotransferase (ALT) and gamma glutamyl transferase (GGT) leak from the liver cells into the bloodstream. As a result, elevated levels of ALT and GGT in the bloodstream can indicate the presence of liver disease.

          Data source and definitions

          The National Health Measures Survey (NHMS) measured the levels of two blood enzymes related to liver function: gamma glutamyl transferase (GGT) and alanine aminotransferase (ALT). While elevated levels for either test may indicate liver damage, they cannot diagnose the presence of liver disease.

          Abnormal liver function as measured by ALT is defined as:

          • an ALT reading of greater than 40 U/L for males and greater than 30 U/L for females

          Abnormal liver function as measured by GGT is defined as:

          • a GGT reading of greater than 30 U/L for children aged 12–14 years
          • a GGT reading of greater than 40 U/L for males aged 15–17 years, and greater than 50 U/L for males aged 18 years and over.
          • a GGT reading of greater than 35 U/L for females aged 15 years and over.

          Alanine aminotransferase (ALT)

          ALT is an enzyme found mainly in the liver that helps the liver metabolise food into energy. Elevated levels of ALT in the blood can occur when the liver is damaged or diseased.²

          In 2011–12, around 1.9 million (11.0%) people aged 18 years and over had abnormal or elevated levels of ALT in their blood. Men were more likely than women to have elevated ALT (13.8% compared with 8.3%).

          The proportion of people with abnormal ALT remained relatively steady through early and middle adulthood, peaking at 13.5% among people aged 45–54 years. Rates then significantly declined to a low of 1.9% among people aged 75 years or over.


          Excess body fat is recognised as a risk factor for liver disease.³ This was reflected in the NHMS results, with 19.5% of those who were obese and 11.6% of people who were overweight having elevated ALT, compared with 4.6% of those who were of normal weight or underweight.

          In 2011–12, many people with abnormal ALT also had risk factors for cardiovascular disease. They were more likely than those with normal ALT to have high total cholesterol (40.9% compared with 32.3%) and low HDL cholesterol (35.7% compared with 21.9%), as well as high triglycerides (26.6% compared with 12.3%). They were also more likely to have diabetes (9.2% compared with 4.6%). About two in five people (40.4%) who had elevated ALT also had high GGT.

          Gamma glutamyl transferase (GGT)

          The enzyme GGT is found in many tissues in the body. It exists in a relatively high concentration in the liver but is also found in the tissues of the kidneys, bile duct, pancreas, gallbladder, spleen, heart, and brain. When any of these tissues are damaged or diseased, GGT leaks from the tissue into the bloodstream. High GGT levels may therefore be indicative of a broader range of conditions and not just liver disease.⁴ 

          In 2011–12, around 2.1 million people aged 18 years and over (12.4%) had abnormal or elevated levels of GGT in their blood. Unlike ALT, the proportion of people with abnormal GGT results generally increased with age, peaking at 20.5% among those aged 55–64 years. Overall, rates were similar for males and females (13.3% compared with 11.6%).


          Similar to ALT, excess body fat increased the likelihood of having abnormal GGT. Around one in five (21.6%) people who were obese had abnormal GGT compared with 12.2% of people who were overweight and 6.0% who were of normal weight or underweight.

          However, unlike ALT, GGT was also associated with blood pressure and smoking. In 2011–12, people with high blood pressure were more likely to have abnormal GGT than people with normal blood pressure (20.2% compared to 10.3%). Similarly, 18.1% of current smokers had abnormal GGT compared with only 9.6% of people who had never smoked.


          People with abnormal GGT were more likely than those with normal GGT to have other chronic disease risk factors, including high total cholesterol (43.7% compared with 31.7%), high triglycerides (32.4% compared with 11.2%), and high LDL 'bad' cholesterol (39.0% compared with 32.4%). They were also more likely to have diabetes (11.5% compared with 4.2%) and to have abnormal results for the chronic kidney disease biomarkers, including albuminuria (12.2% compared with 7.0%) and eGFR (5.9% compared with 3.4%).

          For more information on ALT and GGT, see tables 1, 2, 3, 7, 8 and 9 in the Data downloads section of this publication.

          Endnotes

          Exposure to tobacco smoke

          The National Health Measures Survey (NHMS) included a test for cotinine as an objective measure of smoking status. The body produces cotinine in the process of breaking down, or metabolising, nicotine from tobacco smoke.¹ Levels of cotinine are generally proportionate to the amount of tobacco exposure a person receives through smoking, or in some cases, through exposure to second hand smoke. However, cotinine levels only remain elevated for around 20 hours after exposure to tobacco smoke, therefore it can only provide a measure of short-term exposure.

          Data source and definitions

          Levels of cotinine were measured via a blood test. In the NHMS, cotinine levels of 140 nmol/L or greater indicate exposure to tobacco smoke.

          The Australian Health Survey results for self-reported smoking show that 16.1% of Australians aged 18 years and over were current daily smokers in 2011–12.²

          In the NHMS, the pattern for cotinine exposure was very similar to that for the self-reported smoking data for most age groups. Small differences were evident in the younger age groups, with people aged 18–24 years having slightly higher rates of cotinine exposure compared with their self-reported smoking status. However, the opposite was true for those aged 25–34 years, where the proportion of self-reported smokers was slightly higher than the proportion exposed to cotinine.

          Overall, 87.0% of current smokers aged 18 years and over had cotinine levels indicating exposure to tobacco smoke, compared with only 5.7% of those who were ex-smokers and 0.3% of those who had never smoked.


          For more information on cotinine, see table 8 in the Data downloads section of this publication.

          Endnotes

          Anaemia

          Anaemia is caused by a decrease in either the number of red blood cells in the body or the quantity of haemoglobin within red blood cells. When a person is anaemic, their heart has to work harder to ensure that muscles and organs get the oxygen they need. Haemoglobin is a protein found in red blood cells. It contains a large amount of iron and helps transport oxygen from the lungs to the rest of the body. The National Health Measures Survey (NHMS) measured the concentration of haemoglobin in the blood, which can help diagnose anaemia.

          In Australia in 2011–12, around 760,000 people aged 18 years and over (4.5%) were at risk of anaemia, with women more likely to be at risk than men (6.4% compared with 2.5%).

          The risk of anaemia was highest among older Australians, with rates rapidly increasing after the age of 65 years. People aged 75 years and older were more likely to be at risk of anaemia than all other Australians, with 16.0% in the at risk range compared with 3.6% of Australians aged less than 75 years.


          Research has shown that anaemia is associated with diabetes and chronic kidney disease.² This was reflected in the NHMS results, where 12.6% of those at risk of anaemia had diabetes compared with 4.7% of those not at risk. They were also more likely to have abnormal eGFR, which is a measure of kidney function (16.1% compared with 3.1%).

          For more information on haemoglobin, see tables 1, 2, 3, 8 and 9 in the Data downloads section of this publication.

          Data source and definitions

          Endnotes

          Comparisons with other Australian surveys

          The National Health Measures Survey (NHMS) is the first ABS survey to include a voluntary blood and urine collection. However, biomedical results have been collected at the population level in Australia before, most recently at the national level by BakerIDI Heart and Diabetes Institute and for Victoria only by the Victorian Department of Health. There is strong interest in how the results from the NHMS compare with these two studies.

          The 1999–2000 Australian Diabetes, Obesity and Lifestyle Study (AusDiab) was conducted by BakerIDI. This was a national cross-sectional survey of around 11,000 people aged 25 years and over and was primarily designed to measure the prevalence of diabetes and associated risk factors.¹

          The 2009–10 Victorian Health Monitor (VHM) was conducted by the Victorian Department of Health. This was a cross-sectional, statewide survey of around 3,600 Victorians aged 18–75 years and included biomedical measures for diabetes, cardiovascular disease and indicators of chronic kidney disease.²

          A summary of the surveys is shown below.

          Summary of surveys

           AusDiabVictorian Health MonitorNHMS

          Year

          1999–20002009–102011–12

          Scope

          Adults aged 25 years and over in 99 Collection Districts in all states and in the Northern Territory. Excludes the ACT and Very Remote areas.Adults aged 18–75 years in 50 randomly selected Collection Districts in metropolitan and rural areas of Victoria.Adults and children aged 5 years and over in 2,700 Collection Districts across Australia, randomly selected as part of the Australian Health Survey. Excludes persons in Very Remote areas.

          Sample size

          Approx 11,000Approx 3,600Approx 11,000

          Note: A Collection District (CD) is the second smallest geographic area defined in the Australian Standard Geographical Classification (ASGC), the smallest being the Mesh Block. The CD was designed for use in the Census of Population and Housing as the smallest unit for collection and processing.


          The following sections outline how the results from these two surveys compare with those from the NHMS.

          Diabetes

          The NHMS and VHM both used fasting plasma glucose blood tests to determine diabetes status. For a detailed description of how diabetes was defined in the NHMS, see the Measuring diabetes - definitions section of this publication.

          As shown in the table below, the results from the two surveys were very similar. The NHMS found that 4.3% of people aged 18–75 years in Victoria had diabetes compared with 4.6% found in VHM. VHM had a slightly higher number of people with impaired fasting plasma glucose - 4.3% compared with 3.1% in the NHMS - however the overlapping confidence intervals for these two estimates suggest that this difference is not statistically significant.

          Persons aged 18-75 years in Victoria: comparison of diabetes results for NHMS and VHM

           NHMS 2011–12(a)VHM 2009–10(b)
           %95% CI%95% CI

          Known diabetes(c)

          3.52.2 – 4.83.42.6 – 4.5

          Newly diagnosed diabetes(d)

          0.90.2 – 1.51.20.7 – 1.9

          Total with diabetes

          4.33.0 – 5.74.63.7 – 5.7

          Impaired fasting plasma glucose(e)

          3.12.0 – 4.24.33.3 – 5.7

          a. Based on the fasting population. Estimates are not age-standardised.
          b. Data sourced from Department of Health 2012, The Victorian Health Monitor, State Government of Victoria, Melbourne. Estimates are age-standardised to the 2006 population.
          c. A person was considered to have known diabetes if they had ever been told by a doctor or nurse that they have diabetes and they were taking diabetes medication (either insulin or tablets); OR had ever been told by a doctor or nurse that they have diabetes and their blood test result for fasting plasma glucose was greater than the cut off point for diabetes (that is, ≥7.0 mmol/L).
          d. A person was considered to have newly diagnosed diabetes if they reported no prior diagnosis of diabetes but had a fasting plasma glucose value ≥7.0 mmol/L.
          e. A person was considered to have impaired fasting plasma glucose if they did not currently have diabetes, but had a fasting blood glucose level ranging from 6.1 mmol/L to less than 7.0 mmol/L.


          The 1999–2000 AusDiab study used an Oral Glucose Tolerance Test (OGTT), together with self-reported information on doctor diagnosis and medication use, to determine diabetes. An OGTT involves an initial fasting plasma glucose blood test, followed by a drink of a solution containing 75g of glucose. The person's blood sugar levels are then checked again two hours later. Participants who reported a history of physician diagnosed diabetes and who were 1) taking oral hypoglycemic tablets or insulin injections or 2) had a fasting plasma glucose (FPG) level ≥7.0 mmol/L or 2-hour plasma glucose (2hPG) level ≥11.1 mmol/L were classified as having known diabetes. Participants not reporting diabetes and who had FPG ≥7.0 mmol/L or 2hPG ≥11.1 mmol/L were classified as having newly diagnosed diabetes.³

          BakerIDI has supplied the ABS with previously unpublished 1999–2000 AusDiab diabetes figures based on FPG test results alone. This allows for a more direct comparison with the NHMS results. The FPG rate for AusDiab was slightly lower than that for the NHMS (5.5%), although this is unlikely to be a significant difference given that the confidence intervals overlap.

          The largest difference between the surveys was for newly diagnosed diabetes. More people had newly diagnosed diabetes in AusDiab than in the NHMS, even when using the FPG test.

          Persons aged 25 years and over(a): comparison of diabetes results for NHMS and AusDiab

           NHMS 2011–12(b)AusDiab 1999–2000
           FPG testFPG test(c)OGTT(c)(d)
           %95% CI%95% CI%95% CI

          Known diabetes

          4.53.9 – 5.13.12.3 – 4.03.72.8 – 4.6

          Newly diagnosed diabetes

          1.00.7 – 1.31.81.4 – 2.33.73.0 – 4.4

          Total with diabetes

          5.54.9 – 6.14.93.8 – 6.17.45.9 – 8.8

          a. Based on the fasting populations.
          b. Estimates age-standardised to the 2001 standard population.
          c. Estimates are not age-standardised. Data has been weighted to match the age and sex distribution of the 1998 estimated resident population of Australia aged 25 years and over.
          d. Data sourced from Dunstan et al 2002, The Rising Prevalence of Diabetes and Impaired Glucose Tolerance, The Australian Diabetes, Obesity and Lifestyle Study, Diabetes Care 25: 829–834.


          For other NHMS diabetes results, including for all Australians aged 18 years and over, see the Diabetes prevalence section of this publication.

          Cardiovascular disease

          The NHMS and VHM included several blood tests for risk factors of cardiovascular disease, including cholesterol levels and triglycerides. Both surveys used the same cut-offs for normal and abnormal tests results and included the same definition of dyslipidaemia.

          Again, there was little difference in the results between the two surveys for people aged 18–75 years in Victoria, particularly for total cholesterol and LDL cholesterol. The VHM had slightly higher rates of abnormal triglycerides and lower rates of abnormal HDL cholesterol than the NHMS.

          Persons aged 18-75 years in Victoria: comparison of cardiovascular test results for NHMS and VHM

           NHMS 2011–12(a)VHM 2009–10(b)
           %95% CI%95% CI

          Abnormal total cholesterol (≥5.5 mmol/L)

          33.630.8 – 36.335.633.4 – 37.9

          Abnormal LDL cholesterol (≥3.5 mmol/L)(c)

          32.528.8 – 36.332.329.6 – 35.1

          Abnormal HDL cholesterol (<1.0 mmol/L for men and <1.3 mmol/L for women)

          22.319.2 – 25.415.413.0 – 18.2

          Abnormal triglycerides (≥2.0 mmol/L)(c)

          10.58.2 – 12.914.012.5 – 15.8

          Dyslipidaemia(c)

          58.654.2 – 62.956.853.7 – 59.9

          a. Estimates are not age-standardised.
          b. Data sourced from Department of Health 2012, The Victorian Health Monitor, State Government of Victoria, Melbourne. Estimates are age-standardised to the 2006 population.
          c. Based on the fasting population.


          AusDiab also included tests for cholesterol and triglycerides, using these same thresholds. The prevalence of abnormal total cholesterol and abnormal LDL cholesterol was higher in AusDiab than for the NHMS. AusDiab also had a higher proportion of people with elevated triglycerides. Rates of HDL cholesterol could not be compared due to the use of different cut-offs.

          Persons aged 25 years and over: comparison of cardiovascular test results for NHMS and AusDiab

           NHMS 2011–12(a)AusDiab 1999–2000(b)
           %95% CI%95% CI

          Abnormal total cholesterol (≥5.5 mmol/L)

          35.734.3 – 37.151.248.9 – 53.6

          Abnormal LDL cholesterol (≥3.5 mmol/L)(c)

          35.533.8 – 37.345.743.6 – 47.8

          Abnormal triglycerides (≥2.0 mmol/L)(c)

          15.213.9 – 16.620.618.0 – 22.9

          a. Estimates are age standardised to the 2001 standard population.
          b. Data sourced from International Diabetes Institute 2001, Diabesity & Associated Disorders in Australia - 2000. The Accelerating Epidemic, The Australian Diabetes, Obesity and Lifestyle Study (AusDiab), Melbourne.4 Estimates are not age standardised. Data has been weighted to match the age and sex distribution of the 1998 estimated resident population of Australia aged 25 years and over.
          c. Based on the fasting population.


          For other NHMS cholesterol and triglycerides results, including for all Australians aged 18 years and over, see the Cardiovascular disease section of this publication.

          Kidney function

          The NHMS and VHM included estimated glomerular filtration rate (eGFR) and presence of albuminuria as measures of kidney function. The prevalences of abnormal eGFR and albuminuria for people aged 18–75 years in Victoria were similar for both surveys.

          Persons aged 18-75 years in Victoria: comparison of kidney function test results for NHMS and VHM

           NHMS(a)VHM(b)
           %95% CI%95% CI

          Abnormal eGFR(c)

          2.10.9 – 3.23.52.7 – 4.6

          Presence of albuminuria(d)

          6.04.2 – 7.76.45.3 – 7.6

          a. Estimates are not age-standardised.
          b. Data sourced from Department of Health 2012, The Victorian Health Monitor, State Government of Victoria, Melbourne. Estimates are age-standardised to the 2006 population.
          c. Abnormal kidney function using eGFR is defined as a reading of less than 60 mL/min/1.73m².
          d. The presence of albuminuria is defined as an albumin creatinine ratio (ACR) reading of ≥2.5 mg/mmol for males and ≥3.5 mg/mmol for females.


          The NHMS also included information on chronic kidney disease stages, using a combination of participants' eGFR and urinary albumin creatinine ratio (ACR) results. The AusDiab Kidney Study shows that the prevalence for chronic kidney disease based on the CKD-EPI equation was 11.5%. This was similar to the corresponding rate in the NHMS for people aged 25 years and over (10.4%).

          Persons aged 25 years and over: comparison of chronic kidney disease results for NHMS and AusDiab

           NHMS(a)AusDiab 1999–2000(b)
           %95% CI%95% CI

          Chronic kidney disease

          10.49.7 – 11.111.59.4 – 14.1

          a. Estimates are age-standardised to the 2001 standard population.
          b. Data sources from White et. al. 2010, Comparison of the Prevalence and Mortality Risk of CKD in Australia Using the CKD Epidemiology Collaboration (CKD-EPI) and Modification of Diet in Renal Disease (MDRD) Study GFR Estimating Equations: The AusDiab (Australian Diabetes, Obesity and Lifestyle) Study. Estimates are not age standardised. Data has been weighted to match the age and sex distribution of the 1998 estimated resident population of Australia aged 25 years and over.


          For other NHMS kidney function results, including for all Australians aged 18 years and over, see the Chronic kidney disease section of this publication.

          Endnotes

          About the National Health Measures Survey

          The 2011–13 Australian Health Survey (AHS) is the largest and most comprehensive health survey ever conducted in Australia. The survey, conducted throughout Australia, collected a range of information about health related issues, including health status, risk factors, health service usage and medications. In 2011–13, the AHS incorporated the first ABS biomedical collection, the National Health Measures Survey (NHMS). It involved the collection of a range of blood and urine tests from over 11,000 participants across Australia, which were then tested for various chronic disease and nutrient biomarkers.

          The AHS also included an additional representative sample of Aboriginal and Torres Strait Islander people. The Aboriginal and Torres Strait Islander Health Measures Survey will provide the first biomedical results for Aboriginal and Torres Strait Islander people aged 18 years and over at the population level and provides a unique opportunity to compare results with the non-Indigenous population. Results for the Aboriginal and Torres Strait Islander population will be released progressively from the end of 2013.

          This publication is the first release of information from the NHMS. It focusses on biomarkers of chronic disease, including cardiovascular disease, diabetes and kidney disease. Information on nutrition biomarkers, such as vitamin D, iron and iodine, will be released in late 2013.

          The NHMS has been made possible by additional funding from the Australian Government Department of Health and Ageing as well as the National Heart Foundation of Australia, and the contributions of these two organisations to improving health information in Australia through quality statistics are greatly valued.

          The 2011–13 AHS, and particularly the NHMS component, was developed with the assistance of several advisory groups and expert panels. Members of these groups were drawn from Commonwealth and state/territory government agencies, non-government organisations, relevant academic institutions and clinicians. The valuable contributions made by members of these groups are greatly appreciated.

          Finally, the success of the 2011–13 AHS was dependent on the very high level of cooperation received from the Australian public. Their continued cooperation is very much appreciated; without it, the range of statistics published by the ABS would not be possible. Information received by the ABS is treated in strict confidence as required by the Census and Statistics Act 1905.

          Structure of the Australian Health Survey

          Release schedule

          Data downloads

          Table 1: Chronic disease biomarkers by age then sex — Australia

          Table 2: Chronic disease biomarkers by state and territory

          Table 3: Chronic disease biomarkers by chronic disease biomarkers

          Table 4: Cardiovascular disease biomarkers

          Table 5: Diabetes biomarkers

          Table 6: Kidney disease biomarkers

          Table 7: Liver function biomarkers

          Table 8: Chronic disease biomarkers by selected health risk factors

          Table 9: Chronic disease biomarkers by selected population charcteristics

          Table 10: Prevalence of dyslipidaemia

          Table 11: Prevalence of diabetes (fasting plasma glucose)

          Table 12: Prevalence of diabetes (HbA1c)

          Table 13: Diabetes management (fasting plasma glucose)

          Table 14: Diabetes management (HbA1c)

          Table 15: Selected self-reported conditions by chronic disease biomarkers

          All data cubes

          Survey material

          To view the AHS Biomedical Results brochure click here

          To view the AHS - Cholesterol infographic click here

          To view the AHS - Chronic disease biomarkers national prevalence rates click here

          History of changes

          Show all

          Previous catalogue number

          This release previously used catalogue number 4364.0.55.005.
           

          Back to top of the page