Household Income and Wealth, Australia

Latest release

Key information from the Survey of Income and Housing 2019–20 including distribution of income and wealth by various household characteristics

Reference period
2019-20 financial year

Key statistics

In 2019–20

  • Average equivalised disposable household income was $1,124 per week. 
  • Average net worth for all Australian households in 2019–20 was $1.04 million. 
  • Total average liabilities for households saw a statistically significant increase from $189,500 in 2017–18 to $203,800 in 2019–20.
  • Three in four (75%) households had debt in 2019–20. 
Table 1a – Household income economic well-being indicators(a)(b), Australia, 2009–10 to 2019–20YearChange
Economic Indicators – Income   2009–10 to 2019–202017–18 to 2019–20
 2009–102017–182019–20Difference%Difference%
Gini coefficient for equivalised disposable household income(c)(d)

0.329

0.328

0.324

-0.005

-1.5

-0.004

-1.2

Gini coefficient for gross household income(d)

0.428

0.439

0.436

0.008

1.9

-0.003

-0.7

Mean weekly equivalised disposable household income(c)

$1,034

$1,094

$1,124

$90(e)

8.7

$30

2.7

Mean weekly gross household income

$2,058

$2,310

$2,329

$271(e)

13.2

$19

0.8

Median weekly equivalised disposable household income(c)

$872

$926

$959

$87(e)

10.0

$33(e)

3.6

Median weekly gross household income

$1,610

$1,753

$1,786

$176(e)

10.9

$33

1.9

  1. In 2019–20 dollars, adjusted using changes in the Consumer Price Index 
  2. Due to the change in collection methodology, estimates may not be directly comparable to previous cycles. For more information please see the Household Income and Wealth, Australia - Methodology, 2019–20 financial year
  3. Household net worth is the value of all the assets owned by a household less the value of all its liabilities
  4. The Gini coefficient is the internationally accepted summary measure of inequality. Gini coefficient values range between 0 and 1. Values closer to 0 represent higher equality and values closer to 1 represent higher inequality
  5. The difference between periods is statistically significant
Table 1b – Household wealth economic well-being indicators(a)(b), Australia, 2009–10 to 2019–20YearChange
Economic Indicators – Wealth   2009–10 to 2019–202017–18 to 2019–20
 2009–102017–182019–20Difference%Difference%
Gini coefficient for household net worth(c)(d)

0.602

0.621

0.611

0.009

1.5

-0.010

-1.6

Mean household net worth(c)

$878,200

$1,053,200

$1,042,000

$163,800(e)

18.7

-$11,200

-1.1

Median household net worth(c)

$519,300

$576,000

$579,200

$59,900(e)

11.5

$3,200

0.6

Mean total financial assets(f)

$312,800

$440,600

$445,000

$132,200(e)

42.3

$4,400

1.0

Mean total non-financial assets(g)

$711,700

$802,300

$798,000

$86,300(e)

12.1

-$4,300

-0.5

Mean total liabilities

$146,200

$189,500

$203,800

$57,600(e)

39.4

$14,300(e)

7.5

Proportions of households with debt

71.9

72.8

74.6

2.7pts(e)

..

1.8pts(e)

..

Proportions of households with debt 3 or more times income

24.2

28.4

30.3

6.1pts(e)

..

1.9pts(e)

..


.. not applicable

  1. In 2019–20 dollars, adjusted using changes in the Consumer Price Index 
  2. Due to the change in collection methodology, estimates may not be directly comparable to previous cycles. For more information please see the Household Income and Wealth, Australia - Methodology, 2019–20 financial year
  3. Household net worth is the value of all the assets owned by a household less the value of all its liabilities
  4. The Gini coefficient is the internationally accepted summary measure of inequality. Gini coefficient values range between 0 and 1. Values closer to 0 represent higher equality and values closer to 1 represent higher inequality
  5. The difference between periods is statistically significant
  6. Includes, for example, accounts held with financial institutions (including offset accounts), ownership of an incorporated business, shares, debentures and bonds, trusts, superannuation funds, and loans to other persons
  7. Includes, for example, residential and non-residential property, household contents and vehicles

In 2019–20, compared to 2017–18, average equivalised disposable household income and average net worth for Australian households, saw no statistically different changes.  In contrast, average total liabilities for households and the proportion of households servicing total debt three or more times their annualised disposable income had statistically different increases.

Over the decade to 2019–20,  there were statistically different changes in equivalised disposable household income, average net worth, average total liabilities and the proportion of households servicing total debt three or more times their annualised disposable income.  

  • In 2019–20, the average equivalised disposable household income was $1,124 per week. This was not statistically significantly different from the average in 2017–18 ($1,094 per week), but was statistically significantly different compared to a decade before ($1,034 per week in 2009–10). 
  • The average net worth for all Australian households in 2019–20 was $1.04 million. This was not statistically significantly different from $1.05 million in 2017–18, but an 19% increase compared with 2009–10 ($878,200) was statistically significant.
  • The average total liabilities for households saw a statistically significant increase from $189,500 in 2017–18 to $203,800 in 2019–20, and a 39% increase compared to a decade before ($146,200 in 2009–10).
  • Three in four (75%) households had debt in 2019–20. Of these households, 30% were servicing a total debt three or more times their annualised disposable income, which was a statistically significant increase from 2009-10 (24%) and 2017-18 (28%).
  1. Survey of Income and Housing data was collected in labelled years
  2. In 2019–20 dollars, adjusted using changes in the Consumer Price Index
  3. Due to the change in collection methodology, estimates may not be directly comparable to previous cycles. For more information please see the Household Income and Wealth, Australia - Methodology, 2019–20 financial year
  4. In 2007–08 there was a change in income standards, see the Household Income and Wealth, Australia - Methodology, 2019–20 financial year for more information 
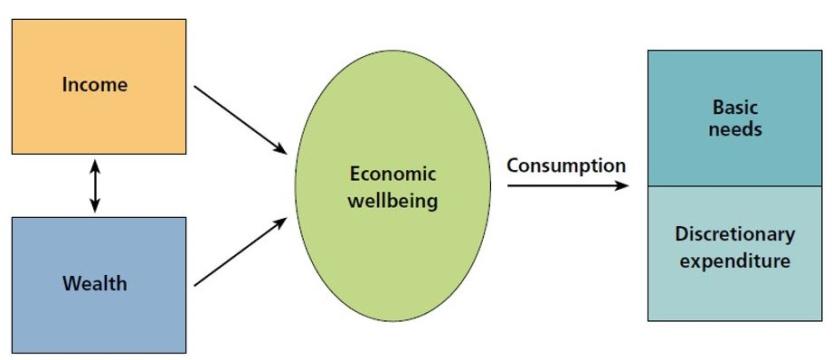
  5. Equivalised disposable household income estimates are adjusted by equivalence factors to standardise them for variations in household size and composition, while taking into account the economies of scale that arise from the sharing of dwellings

Source(s): ABS Survey of Income and Housing, various years

  1. In 2019–20 dollars, adjusted using changes in the Consumer Price Index
  2. Due to the change in collection methodology, estimates may not be directly comparable to previous cycles. For more information please see the Household Income and Wealth, Australia - Methodology, 2019–20 financial year
  3. Comprehensive wealth data was not collected in 2007–08

Source (s): ABS Survey of Income and Housing, various years

Introduction

The 2019–20 Survey of Income and Housing (SIH) collected information about income, wealth and housing from residents in private dwellings in Australia, excluding very remote areas.

The SIH provides:

  • Estimates of the distribution of income and wealth across the population.
  • Detailed information about housing and tenure.

The SIH also collects various characteristics of households and residents giving these key indicators a context to help understand the living standards and economic well-being of people in Australia. These include:

  • employment
  • industry 
  • occupation
  • family make-up
  • disability status
  • education; and 
  • child care use.

The Excel data cubes (available from the Data downloads section) contain the key indicators for various subpopulations and by a range of household and person characteristics, and by state and territory.

About the Survey of Income and Housing

The SIH was conducted annually from 1994–95 to 1997–98, and then in 1999–2000, 2000–01 and 2002–03. From 2003–04 SIH has been conducted every two years and integrated with the Household Expenditure Survey (HES) every six years.

  • SIH/HES: 2003–04, 2009–10, 2015–16.
  • SIH only: 2005–06, 2007–08, 2011–12, 2013–14, 2017–18, 2019–20.

The 2019–20 SIH collected information from a sample of 15,011 households over the period July 2019 to June 2020. For the first time in 2019, SIH respondents could complete their survey online rather than having an interviewer conduct a face-to-face interview. Of the 15,011 households completing SIH, almost half (47%) responded online. The online option enabled respondents to complete their survey while Australia was affected by both bushfires and COVID-19.

The introduction of online data collection means estimates may not be directly comparable to previous SIH estimates. For more information please see the Household Income and Wealth, Australia - Methodology, 2019–20 financial year.

Key concepts

Economic well-being is largely determined by a person's command over economic resources. Income and wealth are the economic resources that households use to support their consumption of goods and services. This publication provides indicators of the level and distribution of household income and household wealth.

The definitions used to measure the economic well-being of people can have a significant impact on the results. The Australian Bureau of Statistics (ABS) follows international best practice and standards for producing statistics relating to household economic resources.

This section provides definitions for the key concepts in this release. Further information on these concepts is provided in the Glossary section of the Methodology page, as well as the User Guide.

Income

Household income consists of all current receipts, whether monetary or in kind, that are received by the household or by individual members of the household, and which are available for, or intended to support, current consumption.

Income includes receipts from:

  • employee income (whether from an employer or own incorporated enterprise), including wages and salaries, salary sacrificed income, non-cash benefits, bonuses and termination payments
  • government pensions and allowances (includes pensions and allowances from Commonwealth and State and Territory governments as well as pensions from overseas)
  • profit/loss from own unincorporated business (including partnerships)
  • net investment income (interest earned, rent, dividends, royalties)
  • private transfers (e.g. superannuation, workers' compensation, income from annuities, child support, and financial support received from family members not living in the same household)

Gross income is the sum of the income from all these sources before income tax, the Medicare levy and the Medicare levy surcharge are deducted. Disposable income is the net income after these deductions.

Some limits have been placed on superannuation and other lump sum payments for inclusion in income, where the amounts received exceeds what is likely to be used to support current consumption (e.g. termination and workers’ compensation lump sum payments).

While income is usually received by individuals, it is assumed to be shared between partners in a couple relationship and with dependent children. To a lesser degree, there may be sharing with other members of the household. Even when there is no transfer of income between members of a household, or provision of free or cheap accommodation, household members are still likely to benefit from the economies of scale that arise from the sharing of dwellings. The income measures shown in this publication therefore relate to household income, rather than personal income. 

Wealth (net worth)

Household wealth (or net worth) is the value of all the assets owned by a household less the value of all its liabilities. 

Assets include:

  • non-financial assets, such as dwellings and their contents, land, and vehicles
  • own incorporated and unincorporated businesses
  • other financial assets such as bank accounts, shares, superannuation accounts, and the outstanding value of loans made to other households or businesses

 Liabilities are primarily the value of loans outstanding including:

  • mortgages
  • investment loans
  • credit card debt
  • borrowings from other households
  • other personal and study loans

Equivalisation

As household size increases, consumption needs also increase but there are economies of scale. An equivalence scale is used to adjust household incomes to take account of the economies that flow from sharing resources and enable more meaningful comparisons between different types of households.

Equivalising factors are calculated based on the size and composition of the household, recognising that children typically have fewer needs than adults. The ABS uses the OECD-modified equivalence scale which assigns a value of 1 to the household head, 0.5 to each additional person 15 years or older and 0.3 to each child under 15 years.

For a lone person household, equivalised income is equal to actual income. For households comprising more than one person, it is the estimated income that a lone person household would need to enjoy the same standard of living as the household in question.

Table 1 shows that a couple household with one child would need $1,800 weekly disposable income to have the same equivalised disposable household income as a lone person household with a disposable income of $1,000.

Household compositionEquivalising factor (x)Disposable income (y)Equivalised disposable income (y/x)
 no.$$
Lone person

1.0

1,000

1,000

Couple only

(1 + 0.5) = 1.5

1,500

1,000

Couple with one child under 15 years

(1 + 0.5 + 0.3) = 1.8

1,800

1,000

Group household with three adults

(1 + 0.5 + 0.5) = 2.0

2,000

1,000

Equivalence scales are mainly used for household income, but can also be used for household wealth.

Household income and wealth

For most Australians, income is the most important resource they have to meet their living costs. Reserves of wealth can be drawn upon to maintain living standards in periods of reduced income or substantial unexpected expenses. Considering income and wealth together helps to better understand the economic wellbeing or vulnerability of households.

Levels of household income and wealth

Distribution of household income and wealth

Low, middle and high income and wealth households

Households with middle and high incomes tend to have a corresponding level of economic well-being and resources. Low income households, however, do not always have a lower level of economic well-being, because low income households may have stores of wealth which help to support their living standards.

In this section, the characteristics of households with different income and wealth levels are compared.

To compare different income levels:

  • High income households refers to the 20% of households in the highest equivalised disposable household income quintile.
  • Middle income households refers to the 20% of households in the third equivalised disposable household income quintile.
  • Low income households refers to the 18% of households in the lowest equivalised disposable household income quintile, adjusted to exclude the first and second percentiles.

In SIH 2013–14, a low income definition was introduced. The objective was to better capture households with low economic resources, by excluding those with nil or negative income, or income significantly below government pension rates. Such households often are either experiencing a temporary economic setback or have stores of wealth to support their living costs. For more information see the feature article in Household Income and Wealth, Australia, 2013–14.

Equivalised disposable household income (EDHI) estimates are adjusted by equivalence factors to standardise them for variations in household size and composition, while taking into account the economies of scale that arise from the sharing of dwellings. When discussing income in this section, we are referring to EDHI.

To compare different wealth levels:

  • High wealth households refers to the 20% of households in the highest net worth quintile.
  • Middle wealth households refers to the 20% of households in the third net worth quintile.
  • Low wealth households refers to the 20% of households in the lowest net worth quintile.

For more information see the Survey of Income and Housing, User Guide, Australia, 2019–20

Characteristics of low, middle and high income households

Changes in income over time

Characteristics of low, middle and high wealth households

Changes in wealth over time

Data downloads

Data files

Fact sheets

The Household Economic Well-being Fact Sheet Series

These fact sheets provide a broad overview of the key concepts and data sources for measuring household economic well-being. The Household Economic Well-being Fact Sheet Series currently comprises:
Fact sheet 1. What is household economic well-being?
Fact sheet 2. Understanding measures of income and wealth
Fact sheet 3. Low economic resource households
Fact sheet 4. Changes over time

The series may be expanded in the future to cover other aspects of these important statistics.

Fact Sheet 1. What is household economic well-being

Fact Sheet 2. Understanding measures of income and wealth

Fact Sheet 3. Low economic resource households

Fact Sheet 4. Changes over time

Previous catalogue number 

This release previously used catalogue number 6523.0

Post-release changes

25 May 2022: Addition of 'Fact Sheets'

28 April 2022: Transposition errors fixed in Key statistics Table 1a and Table 1b. Removal of duplicate sentences in Key concepts. Transposition errors fixed in graphs in the household income and wealth chapter. Transposition errors fixed in graphs in the low, middle and high income and wealth households chapter. Updated the view to 3 decimal places for gini coefficient graphs. Updated links to ABS website within data cubes. 

Back to top of the page