Personal Safety, Australia

Latest release

Rates of physical and sexual assault, family and domestic violence, economic and emotional abuse, stalking, sexual harassment, and childhood abuse.

Reference period
2021-22 financial year

Key statistics

An estimated 8 million Australians (41%) have experienced violence (physical and/or sexual) since the age of 15, including:

  • 31% of women and 42% of men who have experienced physical violence
  • 22% of women and 6.1% of men who have experienced sexual violence

About this release

The Personal Safety Survey (PSS) collected information from persons aged 18 years and over about the nature and extent of their experiences of violence, including detailed information about experiences of:

  • physical and sexual violence
  • violence, emotional abuse, and economic abuse by a cohabiting partner
  • stalking
  • sexual harassment
  • childhood abuse and witnessing parental violence before the age of 15

This publication presents high level prevalence statistics and changes over time for key violence types collected in the survey. For further detailed thematic publications using the PSS data refer to Related publications or follow the links in each chapter. 


The ABS would like to thank those who participated in the survey and acknowledges the experiences of people affected by violence and abuse who are represented in this report.

Some people may find the contents of this report confronting or distressing. Support services are available: 1800RESPECT – 1800 737 732, Lifeline – 13 11 14.

COVID-19 context

The 2021-22 PSS was conducted between March 2021 and May 2022 during the COVID-19 pandemic. Throughout this time, government policies were in place to reduce the spread of COVID-19, including stay-at-home orders, border control measures, limits on gatherings, and social distancing rules. The survey results should be understood and interpreted within the broader context of the wide-ranging changes to everyday life during the pandemic.

Data quality and interpretation

In the written commentary, where a rate is described as higher or lower than a comparative rate, or one group is described as more or less likely to have had an experience than another group, the difference has been found to be statistically significant at the 95% confidence level.

Figures marked with an asterisk (*) have a relative standard error of between 25% and 50% and should be used with caution.

For more information about statistical significance and relative standard error, refer to the Personal Safety, Australia Methodology.
Key findings: violence prevalence and changes over time

The table below presents prevalence rates of violence and abuse for women and men during their lifetime.

Prevalence rate refers to the number of men and women who have experienced the type of violence or abuse within a specified time frame (e.g. since age 15, before age 15, in the last 12 months), expressed as a percentage of all men and women aged 18 years and over.

Violence prevalence rates(a)
WomenMen
Prevalence since the age of 15
 2 in 5 women experienced violence (39%)2 in 5 men experienced violence (43%)
 1 in 5 women experienced sexual violence (22%)1 in 16 men experienced sexual violence (6.1%)
 1 in 3 women experienced physical violence (31%)2 in 5 men experienced physical violence (42%)
 1 in 5 women experienced stalking (20%)1 in 15 men experienced stalking (6.8%)
   
Prevalence of intimate partner and family member violence since the age of 15
 1 in 4 women experienced violence by an intimate partner or family member (27%)1 in 8 men experienced violence by an intimate partner or family member (12%)
 1 in 12 women experienced violence by a family member (8.1%)1 in 17 men experienced violence by a family member (5.9%)
 1 in 4 women experienced violence by an intimate partner (23%)1 in 14 men experienced violence by an intimate partner (7.3%)
 1 in 11 women experienced violence by a boyfriend, girlfriend, or date (9.3%)1 in 44 men experienced violence by a boyfriend, girlfriend, or date (*2.3%)
 1 in 6 women experienced cohabiting partner violence (17%)1 in 18 men experienced cohabiting partner violence (5.5%)
 1 in 4 women experienced cohabiting partner emotional abuse (23%)1 in 7 men experienced cohabiting partner emotional abuse (14%)
 1 in 6 women experienced cohabiting partner economic abuse (16%)1 in 13 men experienced cohabiting partner economic abuse (7.8%)
   
Experiences before the age of 15
 1 in 6 women experienced childhood abuse (18%)1 in 9 men experienced childhood abuse (11%)
 1 in 6 women witnessed parental violence during childhood (16%)1 in 9 men witnessed parental violence during childhood (11%)
  1. Fractions provided are approximations. For precise estimates, refer to the data downloads.

* Estimate has a relative standard error of 25% to 50% and should be used with caution.

Changes over time

12-month national prevalence rates in 2021-22 have been compared with prevalence rates from earlier surveys (2016, 2012 and 2005) to measure changes over time.

Comparisons between 2021-22 and 2016 are described in the commentary. Where the rate is described as having increased or decreased, this has been found to be statistically significant at the 95% confidence level.

Sexual violence

The 12-month prevalence rate of sexual violence remained stable between 2016 and 2021-22 for women.

Women aged 18 years and over, Sexual violence, 12-month prevalence rate(a), 2005 to 2021-22
 2005201220162021-22
Women1.6%(b)1.2%1.8%1.9%
  1. Sexual violence statistics for men have a high relative standard error and are considered too unreliable to measure changes over time.
  2. The difference between the prevalence rate for that year and the 2021-22 prevalence rate is statistically significant.

Physical violence

The 12-month prevalence rate of physical violence remained stable between 2016 and 2021-22 for both men and women.

Physical violence, 12-month prevalence rate, 2005 to 2021-22
 2005201220162021-22
Men(a)10.4%(a)8.5%5.4%6.1%
Women(a)4.7%(a)4.6%3.5%2.9%
  1. The difference between the prevalence rate for that year and the 2021-22 prevalence rate is statistically significant.

Intimate partner violence

The 12-month prevalence rate of intimate partner violence decreased from 2.3% in 2016 to 1.5% 2021-22 for women.

Women aged 18 years and over, Intimate partner violence, 12-month prevalence rate(a), 2005 to 2021-22
 2005201220162021-22
Women(b)2.3%(b)2.1%(b)2.3%1.5%
  1. Intimate partner violence statistics for men have a high relative standard error and are considered too unreliable to measure changes over time. 
  2. The difference between the prevalence rate for that year and the 2021-22 prevalence rate is statistically significant.

Cohabiting partner violence

For women, the 12-month prevalence rate of cohabiting partner violence decreased from 1.7% in 2016 to 0.9% in 2021-22. This was driven by a decrease in the rate of physical violence by a cohabiting partner, from 1.3% in 2016 to 0.7% in 2021-22.

Women aged 18 years and over, Cohabiting partner violence, 12-month prevalence rate(a), By type of violence, 2005 to 2021-22
 2005201220162021-22
Total violence(b)(c)1.5%(c)1.5%(c)1.7%0.9%
 Physical violence(c)1.2%(c)1.4%(c)1.3%0.7%
 Sexual violence0.4%0.3%0.5%0.4%
  1. Cohabiting partner violence statistics for men have a high relative standard error and are considered too unreliable to measure changes over time.
  2. Where a person has experienced both sexual and physical violence by a partner, they are counted separately for each type of violence they experienced but are counted only once in the aggregated total.
  3. The difference between the prevalence rate for that year and the 2021-22 prevalence rate is statistically significant.

Cohabiting partner emotional abuse

For women, the 12-month prevalence rate of cohabiting partner emotional abuse decreased from 4.8% in 2016 to 3.9% in 2021-22. For men, the 12-month prevalence rate of cohabiting partner emotional abuse decreased from 4.2% in 2016 to 2.5% in 2021-22.

Cohabiting partner emotional abuse(a), 12-month prevalence rate, 2012 to 2021-22
 201220162021-22
Women(b)4.7%(b)4.8%3.9%
Men2.8%(b)4.2%2.5%
  1. While the data is comparable across the time series, the list of emotional abuse behaviours asked about in the survey has expanded over time.
  2. The difference between the prevalence rate for that year and the 2021-22 prevalence rate is statistically significant.

Sexual harassment

For women, the 12-month prevalence rate of sexual harassment decreased from 17% in 2016 to 13% in 2021-22. For men, the 12-month prevalence rate of sexual harassment decreased from 9.3% in 2016 to 4.5% in 2021-22.

Sexual harassment(a), 12-month prevalence rate, 2012 to 2021-22
 201220162021-22
Women(b)14.8%(b)17.3%12.6%
Men(b)6.6%(b)9.3%4.5%
  1. Data from 2005 is not included in this analysis as the data is not comparable to subsequent years.
  2. The difference between the prevalence rate for that year and the 2021-22 prevalence rate is statistically significant.

Stalking

For women, the 12-month prevalence rate of stalking remained stable between 2016 and 2021-22.

Women aged 18 years and over, Stalking(a), 12-month prevalence rate(b), 2005 to 2021-22
 2005201220162021-22
Women(c)2.5%(c)4.1%3.1%3.4%
  1. While the data is comparable across the time series, the list of stalking behaviours asked about in the survey has expanded over time.
  2. Stalking statistics for men have a high relative standard error and are considered too unreliable to measure changes over time.
  3. The difference between the prevalence rate for that year and the 2021-22 prevalence rate is statistically significant.

Violence

An estimated 8 million people (41%) aged 18 years and over have experienced violence (physical and/or sexual) since the age of 15, including:

  • 43% of men (4.1 million)
  • 39% of women (3.9 million)

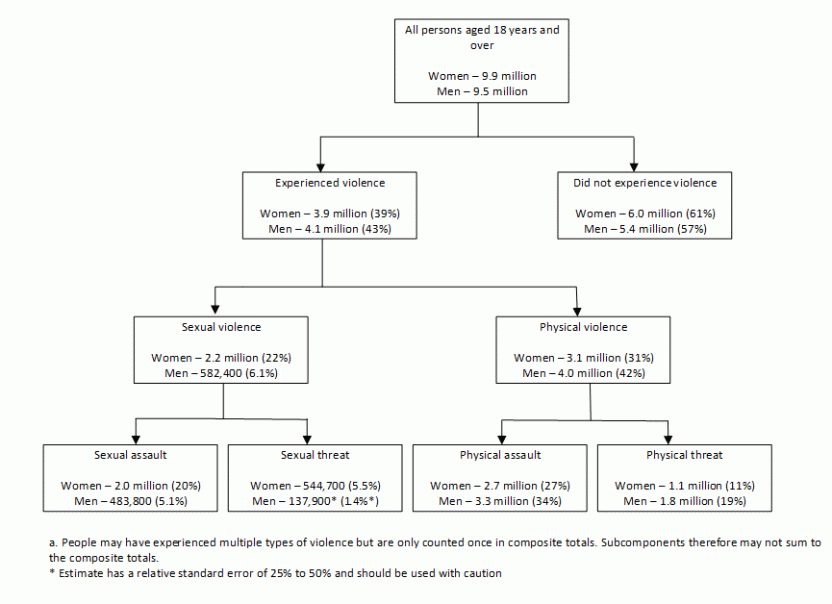
Experiences of violence since the age of 15, By type of violence(a), 2021-22

Row 1: 9.9m women, 9.5m men live in Australia. Row 2: 3.9m women (39%), 4.1m men (43%) experienced violence. Row 3: 2.2m women (22%), 582,400 men (6.1%) experienced sexual violence; 3.1m women (31%), 4.0m men (42%) experienced physical violence. Row 4: 2.0m women (20%), 483,800 men (5.1%) experienced sexual assault; 544,700 women (5.5%), 137,900* men (1.4%*) experienced sexual threat; 2.7m women (27%), 3.3m men (34%) experienced physical assault; 1.1m women (11%), 1.8m men (19%) experienced physical threat.

The flow chart’s top level shows that there were 9.9 million women and 9.5 million men aged 18 years and over living in Australia in 2021-22.

The second level shows that 3.9 million women (39%) and 4.1 million men (43%) experienced violence since the age of 15.

The third level shows that 2.2 million women (22%) and 582,400 men (6.1%) experienced sexual violence since the age of 15. The third level also shows that 3.1 million women (31%) and 4.0 million men (42%) experienced physical violence since the age of 15.

The fourth level shows that, since the age of 15: 2.0 million women (20%) and 483,800 men (5.1%) experienced sexual assault; 544,700 women (5.5%) and 137,900* men (1.4%*) experienced sexual threat; 2.7 million women (27%) and 3.3 million men (34%) experienced physical assault; and 1.1 million women (11%) and 1.8 million men (19%) experienced physical threat.

  1. People may have experienced multiple types of violence but are only counted once in composite totals. Subcomponents therefore may not sum to the composite totals.

* Estimate has a relative standard error of 25% to 50% and should be used with caution.

Perpetrators of violence since the age of 15

Of men aged 18 years and over:

  • 30% (2.9 million) experienced violence by a stranger
  • 25% (2.4 million) experienced violence by a known person

Of women aged 18 years and over:

  • 11% (1.1 million) experienced violence by a stranger
  • 35% (3.5 million) experienced violence by a known person

Men were more likely than women to experience violence by a stranger (30% of men compared with 11% of women). Women were more likely than men to experience violence by a known person (35% of women compared with 25% of men).

Intimate partner or family member violence since the age of 15

An estimated 3.8 million people (20%) aged 18 years and over have experienced violence (physical and/or sexual) by an intimate partner or family member since the age of 15, including:

  • 27% of women (2.7 million)
  • 12% of men (1.1 million) 

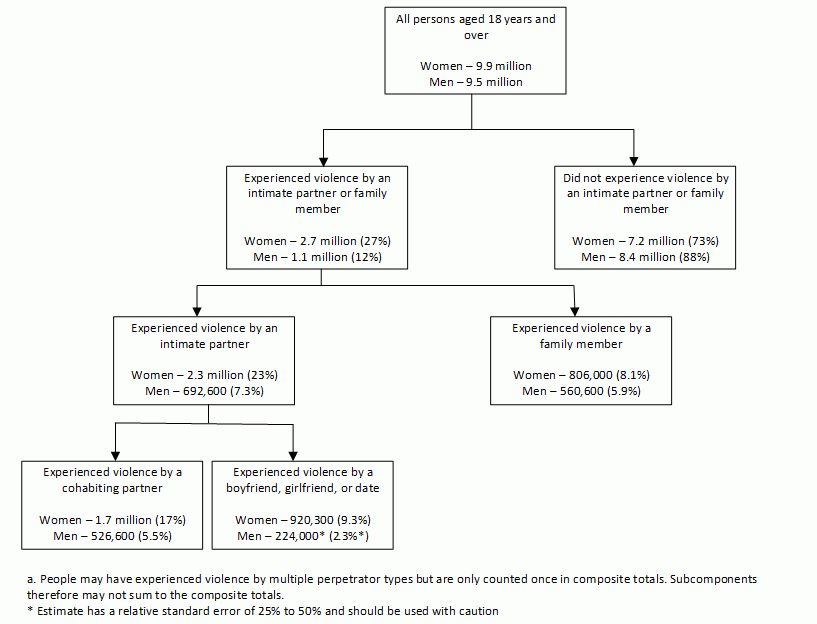
Experiences of violence by an intimate partner or family member since the age of 15(a), 2021-22

Row 1: 9.9m women, 9.5m men live in Australia. Row 2: 2.7m women (27%), 1.1m men (12%) experienced violence by a family member or intimate partner. Row 3: 2.3m women (23%), 692,600 men (7.3%) experienced violence by an intimate partner; 806,000 women (8.1%), 560,600 men (5.9%) experienced violence by a family member. Row 4: 1.7m women (17%), 526,600 men (5.5%) experienced violence by a cohabiting partner; 920,300 women (9.3%), 224,000* men (2.3%*) experienced violence by a boyfriend, girlfriend, or date.

The flow chart’s top level shows that there were 9.9 million women and 9.5 million men aged 18 years and over living in Australia in 2021-22.

The second level shows that 2.7 million women (27%) and 1.1 million men (12%) experienced violence by a family member or intimate partner since the age of 15.

The third level shows that 2.3 million women (23%) and 692,600 men (7.3%) experienced violence by an intimate partner since the age of 15. The third level also shows that 806,000 women (8.1%) and 560,600 men (5.9%) experienced violence by a family member since the age of 15.

The fourth level shows that 1.7 million women (17%) and 526,600 men (5.5%) experienced violence by a cohabiting partner since the age of 15. The fourth level also shows that 920,300 women (9.3%) and 224,000* men (2.3%*) experienced violence by a boyfriend, girlfriend, or date since the age of 15.

  1. People may have experienced violence by multiple perpetrator types but are only counted once in composite totals. Subcomponents therefore may not sum to the composite totals.

* Estimate has a relative standard error of 25% to 50% and should be used with caution.

Of women aged 18 years and over:

  • 23% (2.3 million) experienced violence by an intimate partner
  • 17% (1.7 million) experienced violence by a cohabiting partner
  • 9.3% (920,300) experienced violence by a boyfriend, girlfriend, or date
  • 8.1% (806,000) experienced violence by a family member

Of men aged 18 years and over:

  • 7.3% (692,600) experienced violence by an intimate partner
  • 5.5% (526,600) experienced violence by a cohabiting partner
  • 2.3%* (224,000*) experienced violence by a boyfriend, girlfriend, or date
  • 5.9% (560,600) experienced violence by a family member

Women were more likely than men to experience violence by an intimate partner, cohabiting partner, and boyfriend/girlfriend or date.

Sexual violence

An estimated 2.8 million people aged 18 years and over (14%) experienced sexual violence (assault and/or threat) since the age of 15.

Of women, 22% (2.2 million) experienced sexual violence, including:

  • 20% (2.0 million) who experienced sexual assault
  • 5.5% (544,700) who experienced sexual threat

Of men, 6.1% (582,400) experienced sexual violence, including:

  • 5.1% (483,800) who experienced sexual assault
  • 1.4%* (137,900*) who experienced sexual threat

Women were more likely than men to experience sexual violence (both assault and threat).

  1. Refers to the number of men/women who have experienced sexual violence since the age of 15, expressed as a percentage of all men/women aged 18 years and over.
  2. Estimate for men has a relative standard error of 25% to 50% and should be used with caution.
  3. Includes sexual assault and sexual threat. Where a person has experienced both sexual assault and sexual threat, they are counted separately for each but are counted only once in the aggregated sexual violence total.

See Sexual violence publication for more statistics about socio-demographic characteristics, most recent incident characteristics and responses. 

Physical violence

An estimated 7 million people aged 18 years and over (36%) have experienced physical violence (assault and/or threat) since the age of 15.

Of men, 42% (4.0 million) experienced physical violence, including:

  • 34% (3.3 million) who experienced physical assault
  • 19% (1.8 million) who experienced physical threat

Of women, 31% (3.1 million) experienced physical violence, including:

  • 27% (2.7 million) who experienced physical assault
  • 11% (1.1 million) who experienced physical threat

Men were more likely than women to experience physical violence (both assault and threat).

  1. Refers to the number of men/women who have experienced physical violence since the age of 15, expressed as a percentage of all men/women aged 18 years and over.
  2. Includes physical assault and physical threat. Where a person has experienced both physical assault and physical threat, they are counted separately for each but are counted only once in the aggregated physical violence total.

See Physical violence publication for more statistics about socio-demographic characteristics, most recent incident characteristics and responses. 

Cohabiting partner violence, emotional abuse, and economic abuse

In the PSS, a partner/cohabiting partner refers to a person the respondent lives with, or has lived with at some point, in a married or de facto relationship.

An estimated 4.2 million people aged 18 years and over (21%) have experienced violenceemotional abuse, or economic abuse by a cohabiting partner since the age of 15.

Of women, 27% (2.7 million) have experienced violence or emotional/economic abuse by a cohabiting partner, including:

  • 17% (1.7 million) who have experienced partner violence (physical and/or sexual)
  • 23% (2.3 million) who have experienced partner emotional abuse
  • 16% (1.6 million) who have experienced partner economic abuse

Of men, 15% (1.5 million) have experienced violence or emotional/economic abuse by a cohabiting partner, including:

  • 5.5% (526,600) who have experienced partner violence (physical and/or sexual)
  • 14% (1.3 million) who have experienced partner emotional abuse
  • 7.8% (745,000) who have experienced partner economic abuse

Women were more likely than men to experience violence, emotional abuse, and economic abuse by a cohabiting partner.

  1. Refers to a partner the person lives with, or has lived with at some point, in a married or de facto relationship.
  2. Refers to the number of men/women who have experienced cohabiting partner violence/emotional abuse/economic abuse since the age of 15, expressed as a percentage of all men/women aged 18 years and over.

See Partner violence publication for more statistics about partner violence, emotional and economic abuse, including socio-demographics, behaviours experienced and relationship characteristics.

Sexual harassment

The 2021-22 PSS collected data for experiences of sexual harassment in the last 12 months. Refer to the ‘Key findings: Violence prevalence and changes over time’ section for 2021-22 sexual harassment statistics.

See Sexual harassment publication for more statistics about socio-demographics characteristics, behaviour types experienced, and other incident characteristics.

For lifetime sexual harassment prevalence data from 2016, refer to the ‘Experience of sexual harassment’ section of the 2016 Personal Safety, Australia publication.

Stalking

An estimated 2.7 million people aged 18 years and over (14%) have experienced stalking since the age of 15, including:

  • 20% of women (2.0 million)
  • 6.8% of men (653,400) 

Women were more likely than men to experience stalking.

  1. Refers to the number of men/women who have experienced stalking since the age of 15, expressed as a percentage of all men/women aged 18 years and over.

Childhood abuse

The PSS asks adult respondents about their experiences of physical and sexual abuse perpetrated by an adult before the age of 15. Because the survey asks persons aged 18 years and over about their experiences of abuse before the age of 15, it does not provide estimates of the current prevalence of abuse experienced by children.

Some people may find the contents of this section confronting or distressing. Support services are available: 1800RESPECT – 1800 737 732, Lifeline – 13 11 14.

An estimated 2.7 million people aged 18 years and over (14%) have experienced abuse (physical and/or sexual) by an adult before the age of 15.

Of women, 18% (1.7 million) experienced abuse during childhood, including:

  • 11% (1.1 million) who experienced sexual abuse
  • 10% (988,600) who experienced physical abuse

Of men, 11% (1.0 million) experienced abuse during childhood, including:

  • 3.6% (343,500) who experienced sexual abuse
  • 8.3% (788,400) who experienced physical abuse

Women were more likely than men to experience childhood abuse (both sexual and physical).

  1. Refers to the number of men/women who have experienced abuse by an adult before the age of 15, expressed as a percentage of all men/women aged 18 years and over.
  2. Includes sexual and physical abuse. Where a person has experienced both sexual and physical abuse, they are counted separately for each but are counted only once in the aggregated physical and/or sexual abuse total.

See Childhood abuse publication for more statistics about childhood physical/sexual abuse and witnessing parental violence, relationship to perpetrator and characteristics of the first incident.

Witnessing parental violence during childhood

The PSS asks adult respondents about their experiences of witnessing parental violence before the age of 15. Because the survey asks persons aged 18 years and over about their experiences of witnessing parental violence before the age of 15, it does not provide estimates of the current prevalence of children witnessing parental violence.

Some people may find the contents of this section confronting or distressing. Support services are available: 1800RESPECT – 1800 737 732, Lifeline – 13 11 14.

An estimated 2.6 million people aged 18 years and over (13%) witnessed violence towards a parent by a partner before the age of 15.

Of women, 16% (1.6 million) witnessed parental violence during childhood, including:

  • 14% (1.4 million) who witnessed violence towards their mother
  • 5.0% (498,300) who witnessed violence towards their father

Of men, 11% (1.0 million) witnessed parental violence during childhood, including:

  • 8.9% (853,800) who witnessed violence towards their mother
  • 3.7% (350,000) who witnessed violence towards their father

Women were more likely than men to witness parental violence towards their mother and/or father.

  1. Refers to the number of men/women who have witnessed parental violence before the age of 15, expressed as a percentage of all men/women aged 18 years and over.
  2. Where a person has witnessed parental violence towards both their mother and their father, they are counted separately for each but are counted only once in the aggregated witnessed violence towards mother and/or father total.

See Childhood abuse publication for more statistics about childhood physical/sexual abuse and witnessing parental violence, relationship to perpetrator and characteristics of the first incident.

General feelings of safety

The PSS asks men and women about their general feelings of personal safety in the 12 months prior to the survey, for the following situations:

  • using and waiting for public transport alone after dark
  • walking alone in the local area after dark
  • when home alone after dark

See General feelings of safety publication for more statistics about socio-demographic characteristics and feelings of safety while waiting for and using public transport, walking alone in local area, and when home alone after dark.

State and territory statistics

The state and territory statistics discussed in the following commentary refer to people’s current state/territory of usual residence, which may not necessarily be where the violence occurred.

Two-year prevalence rates are used to measure changes over time and improve the reliability of estimates at the state/territory level. Comparable national two-year prevalence rates are provided throughout tables 9 to 14 in the data downloads.

Two-year prevalence rates in 2021-22 have been compared with prevalence rates from earlier surveys (2016, 2012, 2005) to measure changes over time.

Only comparisons between 2021-22 and 2016 are described in the commentary, and where the rate is described as having increased or decreased, this has been found to be statistically significant at the 95% confidence level.

Additional state/territory data on sexual harassment, stalking, and violence by an intimate partner or family member are included in the data downloads

State/territory statistics are only available for women. For more information, refer to the Methodology page.

For definitions refer to the Glossary.

New South Wales

Victoria

Queensland

South Australia

Western Australia

Tasmania

Northern Territory

Australian Capital Territory

Data downloads

National prevalence and time series (Tables 1 to 8)

National violence and abuse prevalence and time series statistics for men and women.

State and territory prevalence and time series (Tables 9 to 14)

State/territory violence and abuse prevalence and time series statistics for women.

All data downloads

All Personal Safety, Australia 2021-22 data download files.

Post release changes

23/08/2023

Links to additional information added to the Sexual violence, Physical violence and Sexual harassment sections.

General feelings of safety section added.

22/11/2023

Links to additional information added to the Cohabiting partner violence, emotional abuse, and economic abuse, Childhood abuse, and Witnessing parental violence during childhood sections.

Statement about additional releases removed from About this release section.

05/03/2023

Link to Related publications added to the About this release section. 

Links to additional information updated to include more details about the information available. 

Links to thematic releases added to the Related publications section. 

Previous catalogue number

This release previously used catalogue number 4906.0

Related publications

PSS 2021-22 thematic publications

Summary statistics are presented in this publication. The below thematic publications provide in-depth analysis, commentary and data tables for each topic collected in the Personal Safety Survey. 
Sexual violence
Statistics about female experiences of sexual assault, including victimisation rates, socio-demographics, incident characteristics and responses.
Physical violence
Statistics about experiences of physical assault, including victimisation rates, socio-demographics, incident characteristics and responses.
Partner violence 
Statistics about partner violence, emotional and economic abuse, including socio-demographics, behaviours and relationship characteristics.
Sexual harassment
Statistics about sexual harassment, including victimisation rates, socio-demographics, behaviour types, location and other incident characteristics.
Childhood abuse
Statistics about childhood physical/sexual abuse and witnessing parental violence, including prevalence, relationship to perpetrator and disclosure.
General feelings of safety
Statistics about feelings of safety while waiting for and using public transport, walking alone in local area, and when home alone after dark.

Personal Safety, Australia, 2016

Related ABS data sources for family, domestic and sexual violence

Additional statistics about victims of violence (including family, domestic and sexual violence) are published annually in:

Statistics about perpetrators of violence (including family, domestic and sexual violence) are published annually in:

Related conceptual papers and frameworks

The following papers provide context around measuring violence (including family, domestic and sexual violence) in Australia and the differences between available data sources:

Back to top of the page